🔬
📊

Dataset

159 Measurements

🧪

Materials Tested

1 Control + 3 Trials

📐

Properties Measured

Tensile & Fold — MD/CD

🎯

Confidence Level

95%

💻

Analysis Tools

Minitab & Python

⚖️

Main Finding

Tensile–Fold Trade-off

QUALITY ENGINEERING CASE STUDY

Quality Data Analysis

Comparing three abrasive backing paper trials with the current production control.

🧪 Project Overview

Abrasive backing paper must be strong enough to withstand manufacturing and end use while remaining flexible enough to resist cracking during repeated folding. I evaluated three candidate papers against the current production control using tensile strength and fold endurance measurements in both the machine direction (MD) and cross direction (CD).

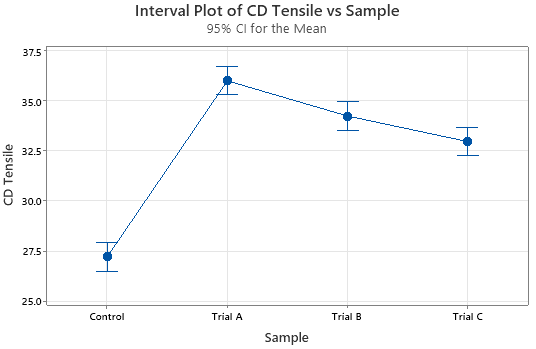
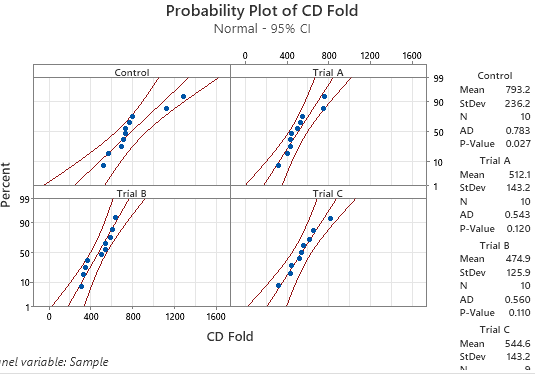
For each response, I compared the group means and 95% confidence intervals, checked the normality and equal variance assumptions, and performed the appropriate one way statistical comparison. Tukey simultaneous confidence intervals were then used to identify which materials differed. I also reproduced the analysis in Python to independently verify the Minitab results.

Why Statistics, Not Just Averages

With approximately ten measurements per material, differences between sample averages may reflect either actual material performance or normal testing variation. Confidence intervals, hypothesis tests, and residual diagnostics allowed me to distinguish between these possibilities and make a more defensible engineering recommendation.
📊 Statistical Analysis Workflow

The analysis followed five stages: comparing material performance, checking normality, evaluating equal variance, identifying significant pairwise differences, and validating the final model.

🛠️ My Role

Data Preparation

  • Organized 159 tensile and fold measurements from one production control and three trial papers into analysis-ready Minitab worksheets.
  • Structured the data by material, test direction, and response variable to support consistent comparisons across CD Tensile, MD Tensile, CD Fold, and MD Fold.
  • Treated a missing CD Fold measurement as missing data rather than replacing it with zero, preserving the accuracy of the calculated mean and sample size.
  • Anonymized supplier information by identifying the materials as Control, Trial A, Trial B, and Trial C before presenting the results externally.

Statistical Analysis

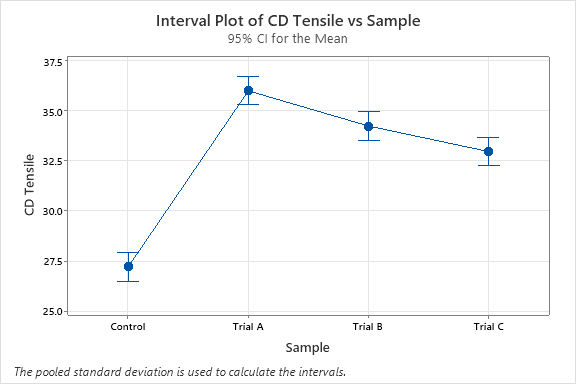
  • Created interval plots to compare material performance using group means and 95% confidence intervals.
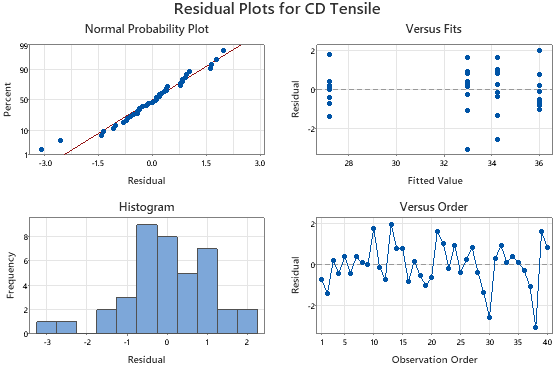
  • Evaluated the normality and equal-variance assumptions using Anderson–Darling probability plots, Levene’s tests, and residual diagnostics.
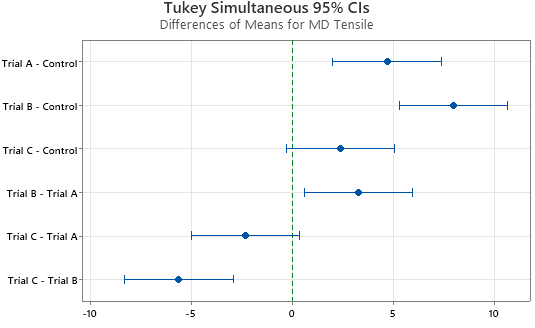
  • Applied one-way ANOVA and Tukey simultaneous confidence intervals to identify both overall material effects and statistically significant pairwise differences.
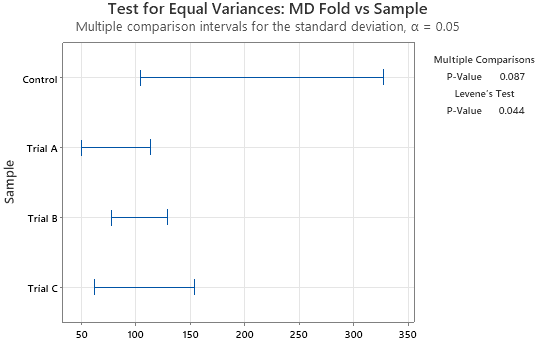
  • Recognized that the MD Fold data did not satisfy the equal-variance assumption and used a variance-robust comparison instead of relying on the standard pooled-variance ANOVA.

Validation and Engineering Recommendation

  • Reproduced the main statistical calculations in Python using SciPy and statsmodels to independently check the Minitab results.
  • Compared tensile strength and fold endurance together rather than selecting a candidate based on one statistically significant result.
  • Identified a clear performance trade-off: the trial papers improved tensile strength but did not match the control’s fold endurance.
  • Translated the results into a practical recommendation while documenting the assumptions, limitations, and need for application-level validation before full material qualification.

🧭 Analysis Process

From preparing the raw measurements to developing a practical material recommendation, the analysis followed four structured stages.

01
🗂️

Data Review & Preparation

Minitab Worksheets Data Cleaning Missing Data Handling

💡 Key Insight: During the initial data review, I identified one missing CD Fold measurement. I preserved it as a missing value rather than replacing it with zero, allowing Minitab to correctly report a sample size of n = 9 for that group without distorting its mean, variance, or subsequent statistical results.

02
📐

Assumption Assessment

Anderson–Darling Test Levene’s Test Residual Diagnostics

💡 Key Insight: The MD Fold equal-variance test returned a Levene’s p-value of 0.044. Because this value was below the 0.05 significance level, the pooled-variance assumption was not supported. I therefore used a variance-robust comparison for MD Fold while retaining the standard equal-variance approach for the other responses.

03
📊

Statistical Comparison

One-Way ANOVA Welch’s ANOVA Tukey Intervals

💡 Key Insight: The four responses showed significant overall material effects, but the pairwise results revealed an important trade-off. The trial papers improved tensile strength, while the production control maintained substantially greater fold endurance. Trial A led CD tensile performance and Trial B led MD tensile performance, showing that no single candidate was strongest in every category.

04
🐍

Independent Validation & Recommendation

Python (SciPy/statsmodels) Result Verification Engineering Communication

💡 Key Insight: I reproduced the main calculations in Python and compared them with the Minitab output to confirm that the conclusions were consistent across both tools. I then translated the statistical results into a balanced recommendation based on the tensile–fold trade-off, while recognizing that application-level testing would still be required before full material qualification.